
Parents, home educators, researchers and journalists
Home Education Statistics in England
Local authorities reported 126,000 children in elective home education in England at the autumn 2025 census date. That is about 1.5% of children of compulsory school age. The figure comes from the Department for Education's latest release, published in January 2026.
That headline is useful, but it needs context. The official collection is still relatively new, became mandatory only in autumn 2024, and is published as "official statistics in development". Better reporting can make the number rise even when family decisions have not changed by the same amount. This page keeps the figures, definitions and caveats together so the numbers are easier to use responsibly.
The latest headline figures
The Department for Education's autumn 2025/26 release reports:
- 126,000 children were known to local authorities as electively home educated on the autumn 2025 census date.
- That represented 1.5% of the compulsory-school-age population in England.
- 111,700 children were recorded at the equivalent autumn 2024 census, so the published count was 14,300 higher one year later.
- 175,900 children were recorded as electively home educated at some point during the 2024/25 academic year, compared with 153,300 during 2023/24.
The census-date measure is a snapshot. The "at any point" measure counts every child who appeared in the local authority's EHE records during the academic year, even if they later returned to school or moved. The two measures answer different questions and should not be combined.
Term-by-term official series
The official census-date dataset currently runs from autumn 2022 to autumn 2025. These are the national totals reported by local authorities:
- Autumn 2022: 80,900 children (1.0%).
- Spring 2023: 86,200 children (1.1%).
- Summer 2023: 97,600 children (1.2%).
- Autumn 2023: 92,000 children (1.1%).
- Spring 2024: 103,500 children (1.3%).
- Summer 2024: 117,900 children (1.4%).
- Autumn 2024: 111,700 children (1.4%).
- Spring 2025: 123,300 children (1.5%).
- Summer 2025: 137,200 children (1.7%).
- Autumn 2025: 126,000 children (1.5%).
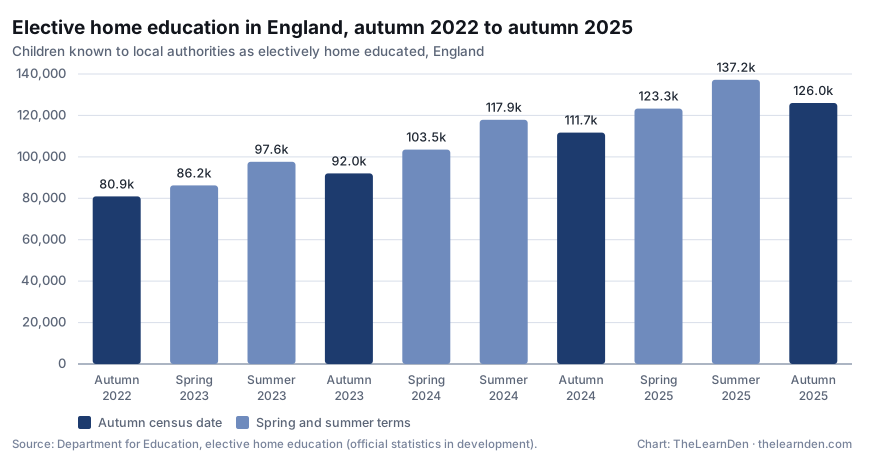
The recurring autumn-to-summer rise is partly about movement during the school year. Some children start the year in school and move to home education later; others return to school before the next autumn census. It does not mean the same children remain in the series throughout.
National figures are rounded to the nearest 100. Percentages and rates may not reproduce exactly from rounded counts.
Which ages are most represented?
The autumn 2025 data becomes more concentrated in the secondary years. Year 11 had the largest recorded group, with 24,100 children (19% of the EHE total), followed by Year 10 with 21,800 (17%) and Year 9 with 18,800 (15%). Year 8 had 14,000 (11%) and Year 7 had 9,700 (8%).
Primary-year counts were lower: 3,600 in Year 1, rising gradually to 8,100 in Year 6. Reception was recorded as 400, but children below compulsory school age are outside the core population used for the rate. The pattern shows where known EHE numbers are concentrated; it does not explain why individual families choose home education.
What local-authority figures show
The latest dataset contains 153 local-authority rows. The largest reported counts were Kent (4,760), Essex (4,100), Lancashire (2,980), Birmingham (2,880), Devon (2,840) and Hampshire (2,780). Large counts partly reflect large child populations, so rates are often more useful for comparison.
The highest published rates were Isle of Wight (4.1%), Blackpool (3.1%), Cornwall and Somerset (both 2.9%), Torbay (2.8%), and Devon and East Sussex (both 2.7%). These are administrative statistics, not a league table: differences can reflect population, local practice, data quality, family circumstances and how quickly records are updated.
Use the search box to find an English local authority. Counts are rounded to the nearest 10. The source uses "low" for suppressed small values, which this table preserves rather than estimating.
153 authorities shown.
| Local authority | Children | Rate |
|---|---|---|
| Barking and Dagenham | 580 | 1.3% |
| Barnet | 380 | 0.6% |
| Barnsley | 800 | 2.3% |
| Bath and North East Somerset | 260 | 1.0% |
| Bedford | 510 | 1.7% |
| Bexley | 460 | 1.1% |
| Birmingham | 2,880 | 1.4% |
| Blackburn with Darwen | 410 | 1.4% |
| Blackpool | 620 | 3.1% |
| Bolton | 670 | 1.3% |
| Bournemouth, Christchurch and Poole | 850 | 1.6% |
| Bracknell Forest | 250 | 1.2% |
| Bradford | 1,400 | 1.4% |
| Brent | 430 | 0.9% |
| Brighton and Hove | 500 | 1.5% |
| Bristol, City of | 720 | 1.2% |
| Bromley | 530 | 1.0% |
| Buckinghamshire | 1,220 | 1.3% |
| Bury | 350 | 1.1% |
| Calderdale | 630 | 2.0% |
| Cambridgeshire | 1,840 | 1.8% |
| Camden | 270 | 1.2% |
| Central Bedfordshire | 770 | 1.6% |
| Cheshire East | 750 | 1.3% |
| Cheshire West and Chester | 650 | 1.3% |
| City of London | Low (suppressed) | Low (suppressed) |
| Cornwall | 2,210 | 2.9% |
| County Durham | 1,370 | 1.9% |
| Coventry | 620 | 1.1% |
| Croydon | 770 | 1.2% |
| Cumberland | 610 | 1.7% |
| Darlington | 410 | 2.6% |
| Derby | 720 | 1.7% |
| Derbyshire | 1,990 | 1.8% |
| Devon | 2,840 | 2.7% |
| Doncaster | 1,160 | 2.5% |
| Dorset | 880 | 1.8% |
| Dudley | 900 | 1.8% |
| Ealing | 670 | 1.2% |
| East Riding of Yorkshire | 760 | 1.7% |
| East Sussex | 2,000 | 2.7% |
| Enfield | 630 | 1.1% |
| Essex | 4,100 | 1.8% |
| Gateshead | 350 | 1.3% |
| Gloucestershire | 1,950 | 2.1% |
| Greenwich | 670 | 1.6% |
| Hackney | 210 | 0.6% |
| Halton | 250 | 1.3% |
| Hammersmith and Fulham | 210 | 1.0% |
| Hampshire | 2,780 | 1.4% |
| Haringey | 310 | 0.9% |
| Harrow | 310 | 0.8% |
| Hartlepool | 270 | 1.8% |
| Havering | 520 | 1.2% |
| Herefordshire, County of | 410 | 1.7% |
| Hertfordshire | 2,020 | 1.0% |
| Hillingdon | 490 | 1.0% |
| Hounslow | 520 | 1.1% |
| Isle of Wight | 690 | 4.1% |
| Isles of Scilly | Low (suppressed) | 1.3% |
| Islington | 320 | 1.4% |
| Kensington and Chelsea | 100 | 0.7% |
| Kent | 4,760 | 1.9% |
| Kingston upon Hull, City of | 830 | 1.9% |
| Kingston upon Thames | 250 | 1.0% |
| Kirklees | 940 | 1.3% |
| Knowsley | 310 | 1.3% |
| Lambeth | 270 | 0.8% |
| Lancashire | 2,980 | 1.6% |
| Leeds | 1,530 | 1.3% |
| Leicester | 870 | 1.4% |
| Leicestershire | 1,220 | 1.2% |
| Lewisham | 480 | 1.2% |
| Lincolnshire | 1,680 | 1.6% |
| Liverpool | 910 | 1.4% |
| Luton | 380 | 0.9% |
| Manchester | 900 | 1.0% |
| Medway | 1,150 | 2.4% |
| Merton | 230 | 0.7% |
| Middlesbrough | 300 | 1.2% |
| Milton Keynes | 650 | 1.2% |
| Newcastle upon Tyne | 510 | 1.2% |
| Newham | 580 | 1.1% |
| Norfolk | 2,520 | 2.1% |
| North East Lincolnshire | 440 | 1.8% |
| North Lincolnshire | 410 | 1.7% |
| North Northamptonshire | 1,050 | 1.8% |
| North Somerset | 420 | 1.3% |
| North Tyneside | 280 | 0.9% |
| North Yorkshire | 1,340 | 1.7% |
| Northumberland | 550 | 1.3% |
| Nottingham | 690 | 1.5% |
| Nottinghamshire | 2,100 | 1.7% |
| Oldham | 420 | 0.9% |
| Oxfordshire | 1,400 | 1.3% |
| Peterborough | 810 | 2.0% |
| Plymouth | 720 | 2.0% |
| Portsmouth | 270 | 0.9% |
| Reading | 350 | 1.4% |
| Redbridge | 360 | 0.7% |
| Redcar and Cleveland | 350 | 1.8% |
| Richmond upon Thames | 170 | 0.5% |
| Rochdale | 520 | 1.3% |
| Rotherham | 740 | 1.8% |
| Rutland | 50 | 0.8% |
| Salford | 480 | 1.1% |
| Sandwell | 930 | 1.5% |
| Sefton | 430 | 1.1% |
| Sheffield | 830 | 1.0% |
| Shropshire | 740 | 1.7% |
| Slough | 460 | 1.4% |
| Solihull | 470 | 1.3% |
| Somerset | 2,270 | 2.9% |
| South Gloucestershire | 600 | 1.4% |
| South Tyneside | 340 | 1.6% |
| Southampton | 640 | 1.8% |
| Southend-on-Sea | 700 | 2.5% |
| Southwark | 390 | 1.0% |
| St. Helens | 460 | 1.8% |
| Staffordshire | 1,760 | 1.4% |
| Stockport | 500 | 1.1% |
| Stockton-on-Tees | 470 | 1.5% |
| Stoke-on-Trent | 650 | 1.5% |
| Suffolk | 1,730 | 1.6% |
| Sunderland | 600 | 1.5% |
| Surrey | 2,410 | 1.3% |
| Sutton | 300 | 0.8% |
| Swindon | 500 | 1.3% |
| Tameside | 410 | 1.1% |
| Telford and Wrekin | 620 | 2.0% |
| Thurrock | 540 | 1.7% |
| Torbay | 500 | 2.8% |
| Tower Hamlets | 390 | 0.9% |
| Trafford | 260 | 0.6% |
| Wakefield | 1,020 | 1.9% |
| Walsall | 670 | 1.4% |
| Waltham Forest | 450 | 1.1% |
| Wandsworth | 190 | Low (suppressed) |
| Warrington | 320 | 1.0% |
| Warwickshire | 1,530 | 1.7% |
| West Berkshire | 280 | 1.1% |
| West Northamptonshire | 1,050 | 1.6% |
| West Sussex | 2,140 | 1.7% |
| Westminster | 180 | 1.0% |
| Westmorland and Furness | 370 | 1.3% |
| Wigan | 690 | 1.4% |
| Wiltshire | 1,110 | 1.5% |
| Windsor and Maidenhead | 290 | 1.2% |
| Wirral | 520 | 1.1% |
| Wokingham | 310 | 1.0% |
| Wolverhampton | 590 | 1.3% |
| Worcestershire | 1,280 | 1.5% |
| York | 280 | 1.1% |
Download our clean local-authority extract for autumn 2025. It contains the authority name, ONS code, rounded child count and published rate for all 153 authorities. The extract is derived directly from the DfE CSV and keeps suppression labels such as "low" rather than trying to estimate hidden values.
Why families say they home educate
The same collection asks local authorities to record why. Of the reasons known or provided in autumn 2025, mental health was the most reported at 16%, followed by philosophical or preferential reasons at 12%. Around three in ten records give no reason at all, so these shares describe the recorded reasons, not all home-educating families.
Why different sources give different totals
Before the DfE collection, the Association of Directors of Children's Services ran voluntary surveys. Its 2021 survey received responses from 126 local authorities and estimated 81,196 EHE children on 7 October 2021. The report stressed that there was no statutory register and local authorities could not know the true cohort size.
The ADCS estimate and the newer DfE series should not be drawn as one seamless trend line. They differ in coverage, collection process, timing and completeness. The DfE's first EHE and children-missing-education statistics were published in 2023, and the national collection became mandatory in autumn 2024. That creates a visible methodology break.
The House of Commons Library's June 2026 briefing uses the DfE release and notes that the improving data collection makes long-term growth difficult to estimate. That is the safest interpretation: the current count is the best official snapshot, but it is not a precise measure of how much family behaviour changed over the whole period.
What is and is not counted
The DfE release covers children of compulsory school age in England who are known to local authorities as receiving elective home education. It does not include children receiving local-authority education otherwise than at school or school pupils who are persistently absent.
Children missing education are counted separately. Local authorities reported 34,700 children missing education on census day in autumn 2025, down 4,500 on the year before. Nine per cent of those were recorded that way because their home education was judged unsuitable - a reason the Department says continued to increase, and now the third most reported.
Education is devolved, so England's figures are not a UK total. Wales, Scotland and Northern Ireland use different systems and publish different information. This page uses "UK" only where describing common search language; every numerical table here is labelled as England-only.
Wales publishes its own count. In the 2024/25 academic year 7,176 children were known to be electively home educated in Wales, reported separately from the EOTAS census rather than as part of it. That is a rate of 15.3 in every 1,000 pupils, up from 1.6 in every 1,000 in 2009/10. It is an academic-year figure rather than a census-day count, so it is not directly comparable with the England number above.
Local-authority and regional figures are rounded to the nearest 10, national figures to the nearest 100, and small values may be suppressed. The source is updated annually; the next DfE release is expected in winter 2026 with data through autumn 2026.
Method and source record
We downloaded the DfE's Elective home education at census date dataset on 29 July 2026. The API dataset ID is 019bb857-0b36-7011-8d52-15ea8c0d18b0. The file contained 58,968 rows across national, regional and local-authority geography, with breakdowns by sex, year group and primary reason.
The source CSV's SHA-256 checksum was 3b15c04bfd4bdbf304d5fe569d84f9d9543303e04a40cd9638beb5d0eb5dbb8e. We selected only records labelled National, Total and Total for the term series, and Local authority, autumn 2025/26, Total and Total for the downloadable authority extract. We did not infer suppressed values.
This page is maintained by TheLearnDen Editorial Team. We will refresh the figures after each annual DfE release and keep the previous methodology notes visible when definitions or collection practice change.
How to cite this dataset
You are welcome to reuse the chart and the local-authority extract on this page, including in news and research writing, provided the Department for Education is credited as the source of the underlying figures and TheLearnDen as the source of the extract.
For a reference list:
- TheLearnDen (2026) Elective home education by local authority, England, autumn 2025 [data extract]. Derived from Department for Education, Elective home education. Available at: https://thelearnden.com/guides/home-education-statistics-uk/
- For the underlying statistics, cite the Department for Education's autumn 2025/26 release directly.
Two things are worth checking before you publish a figure from this page. Quote the census-date measure and the "at any point" measure separately, because they count different things and are often mixed up. And state the term you are quoting: the seasonal pattern means a summer figure and an autumn figure are not interchangeable.
The statistics are Crown copyright and are published by the Department for Education on the Explore Education Statistics service, where the reuse terms for the original data are stated. Our extract adds no figures of its own: it reformats the published data and records how it was selected.
If you are writing about this and want the underlying selection checked, or a cut we have not published, contact us through the contact page.
Change log
Original data reports should not change silently underneath the people citing them, so every substantive revision to this page is recorded here.
| Date | Change |
|---|---|
| 24 August 2026 | Added the Wales count, children-missing-education context and recorded reasons for home education. |
| 10 August 2026 | Added the term-by-term chart, the downloadable term series, this change log and the citation guidance. No figures changed. |
| 5 August 2026 | Figures updated to the Department for Education autumn 2025/26 release, with the source checksum recorded in the method section. |
| 30 July 2026 | First published. |
When the next annual release lands we will publish it as a new edition and keep the previous period's figures and methodology visible, rather than overwriting them.
Frequently asked questions
How many children are home educated in England?
Local authorities reported 126,000 children in elective home education on the autumn 2025 census date, about 1.5% of compulsory-school-age children in England. The figure is rounded and is published as official statistics in development.
Are home education numbers rising?
Published counts are higher than in earlier releases, but the DfE says changes over time partly reflect improving data quality. The collection is relatively new and became mandatory in autumn 2024, so the figures cannot cleanly separate behavioural change from better reporting.
Do these figures cover the whole UK?
No. The figures on this page cover England. Education is devolved, and Wales, Scotland and Northern Ireland collect and publish home education information differently.
Why is the summer count higher than the autumn count?
Some children move from school to home education during the academic year, while others return to school before the next autumn census. The term snapshots therefore describe a changing group rather than one fixed cohort.
Share this guide
Send the canonical page to another parent, carer or learner. No personal details are added.
Free email digest
Get The Den Digest
The Den Digest — our free newsletter for home-educating families. A short email when we publish new guides and find resources worth your time. No spam, unsubscribe any time.